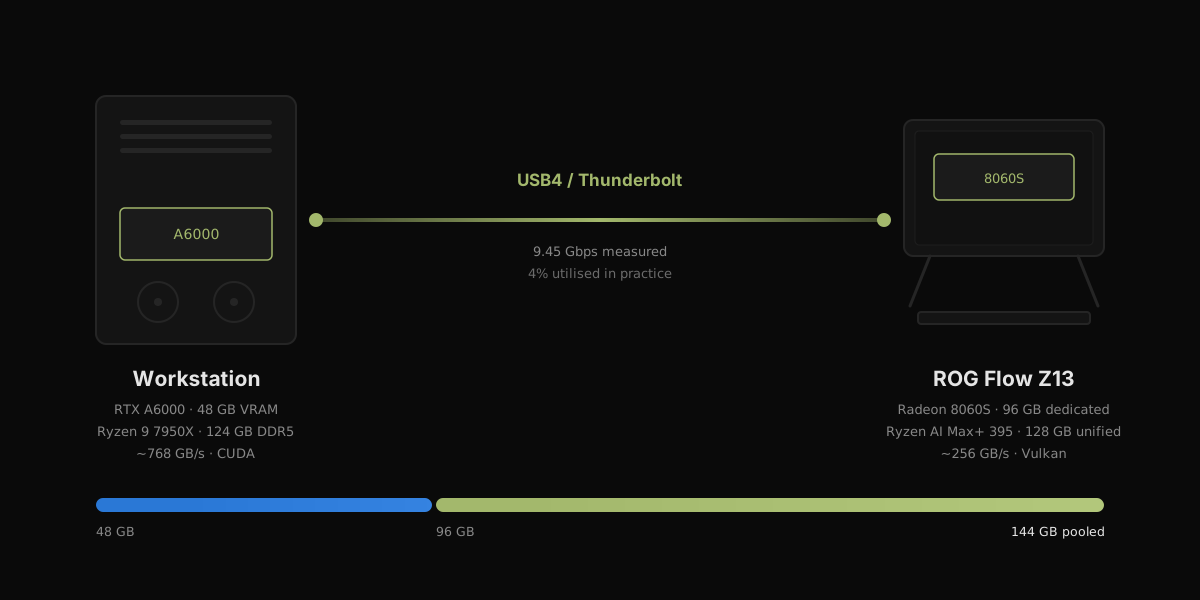
I have an RTX A6000 with 48 GB of VRAM and a ROG Flow Z13 tablet whose Ryzen AI Max+ 395 can dedicate 96 GB of unified memory to its integrated GPU. Neither machine can hold Qwen3.8-Flash-Next, a 177B mixture-of-experts model, at a usable quantization. Together they have 144 GB, which is plenty.
So I connected them with a Thunderbolt cable and split the model across both.
It worked. I got the model running at its full 262,144-token context with a q8 KV cache, generating around 30 tokens per second. Then I ran the control I should have run first, and it turned out the cable was making things slower.
The two machines
| Workstation (“GPURIG”) | ROG Flow Z13 tablet | |
|---|---|---|
| Accelerator | NVIDIA RTX A6000, 48 GB GDDR6 | Radeon 8060S (Strix Halo), 96 GB dedicated |
| CPU | Ryzen 9 7950X, 16C/32T | Ryzen AI Max+ 395 |
| Memory | 124 GB DDR5 | 128 GB unified, 32 GB left to the OS |
| Memory bandwidth | ~768 GB/s to the A6000 | ~256 GB/s unified |
| OS | Ubuntu, kernel 6.14 | Windows 11 |
| Backend | CUDA | Vulkan |
The premise was simple. The tablet’s unified memory runs at roughly 256 GB/s, about three times what DDR5 delivers on the workstation. If I have to put part of a model in slow memory, the tablet’s slow memory is faster than the workstation’s slow memory. A direct Thunderbolt link between the two measured 9.45 Gbps, which seemed like more than enough.
Getting the link up was the easy part, eventually
Two machines connected by a USB4 cable will negotiate a host-to-host network link. On Linux that appears as thunderbolt0 once thunderbolt-net is loaded; on Windows it shows up as a USB4 P2P network adapter.
The part that cost me an afternoon: my Thunderbolt card only negotiates that link on a cold power-on. Once the peer disconnects, nothing short of a reboot brings it back. I tried unbinding and rebinding the driver, removing the device from the PCI tree and rescanning, cycling the hotplug slot power, and issuing a secondary bus reset. Every one of them re-enumerated the card cleanly and none of them restored the link.
[Sat Sep 12 13:36:55] thunderbolt 0-3: new host found, vendor=0x45e device=0x83f
[Sat Sep 12 13:36:55] thunderbolt 0-3: Microsoft Corporation Windows USB4(TM) Connection Manager
That message appears one second after boot, every time, with no cable reseat needed. It just never appears any other time.
Worth noting for anyone doing this: usb usb2-port2: config error in dmesg is not an error to chase. It is the connector noticing a cable it cannot enumerate as a USB device, which is exactly what a host-to-host link looks like. It preceded every successful connection I made.
Only 5 GiB of a 104 GiB model is hot
llama.cpp can offload part of a model to a remote machine through its RPC backend. The naive approach is to split by proportion: give the fast device 40% of the layers and the slow one 60%. I did that first and it was wrong.
Dumping the tensor table shows why:
| Tensor group | Size | Read per token |
|---|---|---|
Routed expert FFNs (ffn_*_exps) | 71.7 GiB | 10 of 512 experts |
| Per-layer token embeddings | 26.8 GiB | one row per layer |
| Attention, norms, router, output | 5.1 GiB | all of it |
This is a sparse mixture-of-experts model with 512 experts, of which 10 routed plus one shared fire on any given token. The expert weights dominate the file size and are read almost not at all. Meanwhile the attention stack, the norms, the router and the output projection — the 5 GiB that runs on every single token — is a rounding error in storage terms.
A proportional split scatters that hot 5 GiB across both devices for no reason. The right move is to pin everything hot on the fast device, fill whatever VRAM remains with expert layers, and push the cold remainder across the wire. llama.cpp’s --override-tensor does this with a regex:
-ot "per_layer_token_embd=RPC0[10.55.0.2:50052],blk\.(19|2[0-9]|3[0-9]|4[0-7])\.ffn_.*_exps=RPC0[10.55.0.2:50052]"Which produced the placement I wanted:
CUDA0 model buffer size = 33806.45 MiB   hot tensors + expert layers 0-18
RPC0  model buffer size = 44250.00 MiB   expert layers 19-47
CPU_Mapped              = 27465.95 MiB   per-layer embeddings
That third line is llama.cpp overruling me. I told it to put the per-layer embedding table on the tablet and it put it in host RAM anyway. It turns out to be right: that tensor is about 51 billion values and 26% of the model, but you read roughly 4 KB of it per token. It is the coldest data in the model and host RAM is the correct place for it.
Three llama.cpp specifics cost me real time and are worth writing down:
- The
-tsdevice order is reversed from what--list-devicesprints. RPC devices get inserted at the front of the device list, so-ts 0,1means “nothing to the remote.” - Only the last
-otflag is honoured. Pass two and the first is silently dropped. Comma-separate them inside one argument. --fit offbreaks RPC offload. It hangs the load indefinitely with no error.
It worked
With the Unsloth fork of llama.cpp on both machines — mainline has no MTP graph for this architecture — the model loads across both devices at its full native context.
n_ctx: 262144
CUDA0: 45,297 MiB used of 48,507
262,144 tokens of context, a q8 KV cache, and roughly 30 tokens per second of generation. The KV cache is surprisingly cheap here: only 12 of the 48 layers use full attention and there are just two KV heads, so the whole cache at maximum context is under a gigabyte.
Adding MTP speculative decoding — a 2.6 GB draft head that proposes tokens for the main model to verify — took generation from 20 to 30 tokens per second.
At that point I had a working 177B model spread across a workstation and a tablet, and I was pleased with myself.
The control run
I had been comparing my numbers against a colleague’s near-identical workstation running the same model with the expert weights in host DDR5 instead of on a tablet. His rig generated 25.1 tokens per second. Mine did 30. The cable was winning.
Except I had never run that configuration on my own machine. I was comparing my hardware to his hardware, his quantization, his context length, and his cache hit rate, and calling the difference “the tablet.”
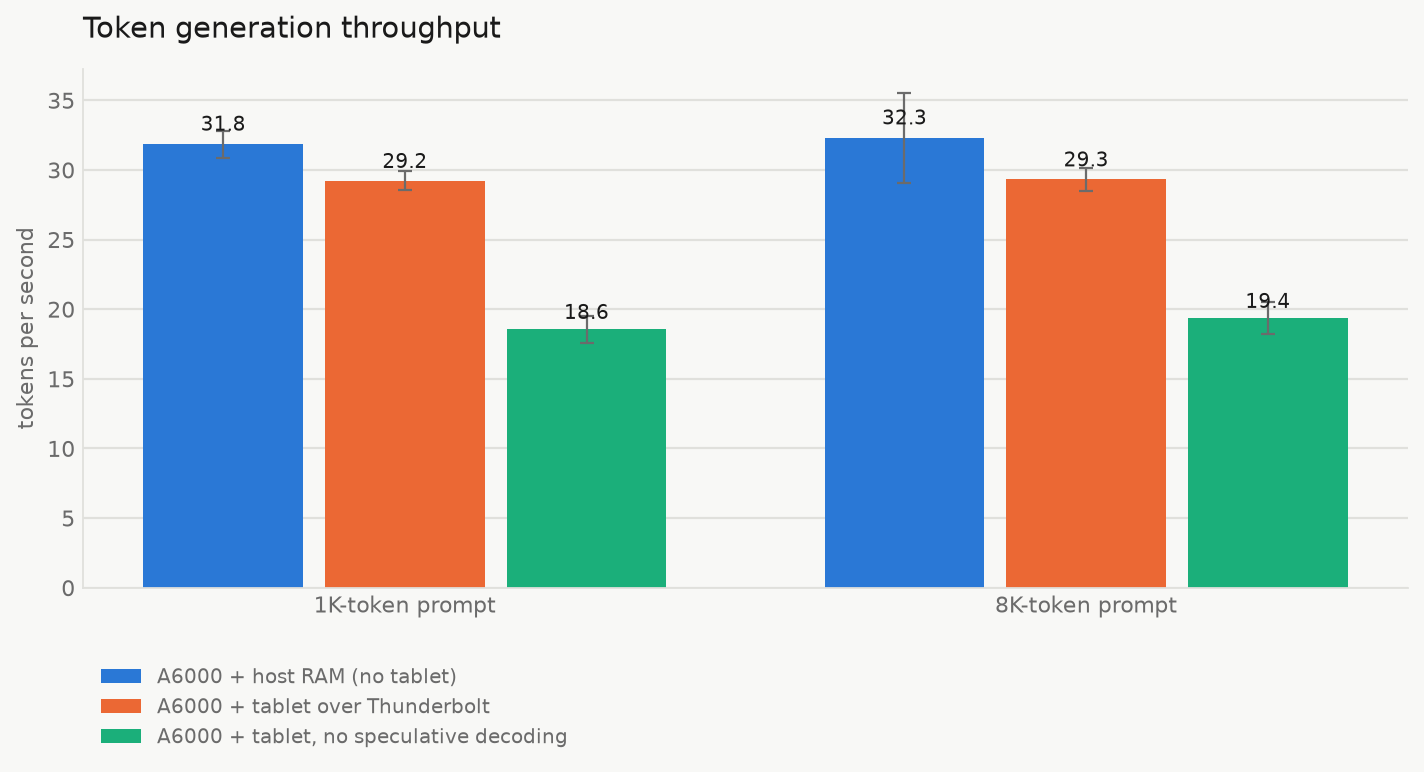
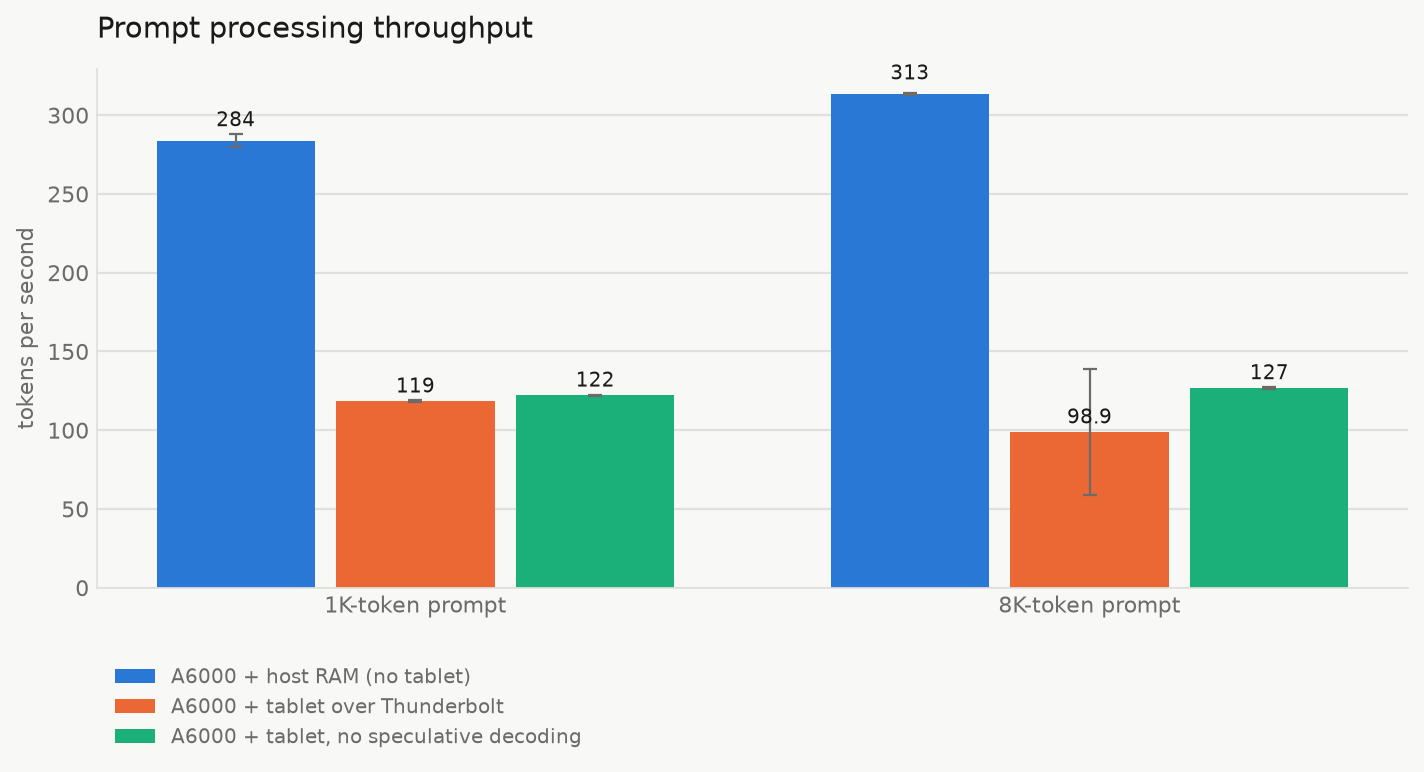
So I ran it properly: same model, same 32K context, same quantization, same draft head, same expert layer count. The only difference is whether the cold expert layers live on the tablet across Thunderbolt, or in the workstation’s own DDR5. Three repetitions of each.
| Configuration | Prompt | Generation t/s | Prompt t/s |
|---|---|---|---|
| A6000 + host RAM, no tablet | 1K | 31.8 ± 1.0 | 284 ± 4 |
| A6000 + host RAM, no tablet | 8K | 32.3 ± 3.2 | 313 ± 0 |
| A6000 + tablet over Thunderbolt | 1K | 29.2 ± 0.7 | 119 ± 1 |
| A6000 + tablet over Thunderbolt | 8K | 29.3 ± 0.8 | 99 ± 40 |
| A6000 + tablet, no speculative decoding | 1K | 18.6 ± 1.0 | 122 ± 0 |
| A6000 + tablet, no speculative decoding | 8K | 19.4 ± 1.1 | 127 ± 1 |
The tablet loses on both measures. Generation is about 9% slower. Prompt processing is two and a half to three times slower. And the no-tablet configuration loads in ten seconds, because nothing has to cross a cable, against roughly seven minutes for the pooled setup.
The speculative decoding result holds up independently and is the one unambiguous win: 18.6 to 29.2 tokens per second, a 1.57x improvement, right in the range the model authors quote.
Why the cable loses
The obvious hypothesis is bandwidth. It is not bandwidth. Under sustained generation the link carries about 342 Mibps against a measured capacity of 9,450. That is four percent utilisation.
The answer is in how llama.cpp’s RPC backend talks. Reading ggml-rpc.cpp, every call to compute a graph serialises the entire graph description and ships it:
static uint8_t * serialize_graph(uint32_t device, const ggml_cgraph * cgraph, ...) {
    for (uint32_t i = 0; i < n_nodes; i++) {
        add_tensor(cgraph->nodes[i], cgraph, dispatcher, tensors, visited);
    }
    ...
}
Each tensor becomes an rpc_tensor struct: an id, a type, a buffer handle, four dimensions, four strides, an op code, 64 bytes of op parameters, ten source pointers, view information, a data pointer, a 64-byte name, and a use count. That is 304 bytes per tensor. The subgraph running on the tablet has somewhere around 4,900 tensors.
304 bytes × ~4,900 tensors ≈ 1.5 MB per token
1.5 MB × 28 tokens/sec      ≈ 42 MB/s
Which is exactly the traffic I measured. The layer-boundary activations that actually need to cross are about 10 KB. Everything else is metadata describing a graph whose shape has not changed.
There is a mechanism to avoid this. The backend can send a 16-byte “recompute the last graph” message instead:
bool reuse = cgraph->uid != 0 && rpc_dev_ctx->last_graph_uid == cgraph->uid;But that cache holds exactly one entry, and ggml-backend.cpp assigns a fresh uid every time the scheduler re-splits the graph. Speculative decoding alternates between a draft graph and a verify graph. Prefill and decode have different shapes. So the single slot thrashes and nearly every step pays the full 1.5 MB.
That is the cost the tablet has to overcome, and its 3x memory bandwidth advantage on cold expert weights does not overcome it.
The other thing that happened
Mid-benchmark, the tablet bugchecked.
Event 41   : rebooted without cleanly shutting down first
Bugcheck   : 0x133 DPC_WATCHDOG_VIOLATION
             param1 = 0x1 (cumulative time at IRQL >= DISPATCH_LEVEL exceeded)
A kernel driver held a high interrupt level too long. Under this workload the candidates are the AMD graphics driver under sustained Vulkan compute or the USB4 networking stack. Measuring afterwards, the tablet was writing about 74 MB/s to its pagefile continuously, with 41 GB of a 50 GB pagefile in use — Windows had 31.6 GB of RAM to back a 44 GB GPU allocation, and the rest lived on disk.
I have not proven the paging caused the crash. But a setup that hard-crashes once in an afternoon of benchmarking is a different proposition from one that does not, and the no-tablet configuration has never crashed.
What I would tell someone considering this
If you want maximum tokens per second on a model that does not fit in VRAM, keep the overflow in your workstation’s own RAM. It is faster on both metrics, it starts in seconds, there is no second machine to keep alive, and nothing bugchecks.
The distributed setup earns its place when the model genuinely will not fit any other way. At 144 GB of pooled VRAM I can hold quantizations that 48 GB plus host RAM would have to page through. That is a capability argument, not a performance one, and I conflated the two for most of a day.
Speculative decoding is worth more than the interconnect. A 2.6 GB draft head bought 57% on generation. No amount of cable got close to that.
And run the control first. I had a result I liked, measured against someone else’s machine, and it took an uncomfortable question to make me test the thing I had assumed. The honest version of this project is more interesting than the version where the cable won.
The llama.cpp RPC finding seems worth reporting upstream. A two-entry graph cache instead of one would likely recover most of the loss, and dropping the 64-byte tensor name from the wire format would cut another fifth.