This is a follow-up to Benchmarking TensorRT-LLM on an RTX A6000, which covered Docker GPU passthrough, container startup, a TinyLlama smoke test, serving Qwen2.5-7B-Instruct through TensorRT-LLM’s OpenAI-compatible endpoint, and the first latency and streaming TTFT benchmarks. That article ended by pointing toward what happens when more than one request hits the server at a time.
This article picks up from there.
Why I ran this follow-up
The first article proved I could serve a model on a single RTX A6000 and measure its latency. The obvious next question was: what happens when I put actual load on it?
I wanted to see how TensorRT-LLM behaved when multiple requests were in flight and the input prompt size varied. I expected a clean, intuitive graph: larger prompts take longer to process, and higher concurrency increases latency. Simple enough.
I got a better lesson.
What changed from the first article
The serving stack stayed the same:
- GPU: NVIDIA RTX A6000, 48 GB VRAM
- Container:
nvcr.io/nvidia/tensorrt-llm/release:1.1.0 - Model: Qwen/Qwen2.5-7B-Instruct
- Endpoint: OpenAI-compatible
/v1/chat/completionson host port 8001 - max_tokens: 128
What changed:
- Concurrency levels: 1, 2, 4, 8, 16, 32, 64
- Synthetic prompt sizes: 16, 32, 64, 128, 256, 512, 768, 900
- Modes: both non-streaming and streaming
- Warmup sweep before the clean benchmark run
- Metrics captured: latency, TTFT, decode time, prompt_tokens, completion_tokens, tokens/sec
Each benchmark case ran 32 requests. The benchmark used a prompt template with a synthetic parameter that controlled how many times a short text block was repeated. The idea was to vary the input token count in a controlled way.
My first assumption was too simple
I started by looking at total latency across the different prompt sizes and concurrency levels. I expected total latency to increase monotonically as the synthetic prompt_size grew, because larger prompts mean more tokens to prefill.
The graph didn’t look like that.
The tiny prompt cases — synthetic prompt_size 16, 32, and 64 — clustered at the high end of total latency, often higher than the 128 and 256 cases. That was the first warning sign. If prompt_size 16 was giving me higher latency than prompt_size 128, something about my measurement was misleading me.
The benchmark trap: synthetic prompt_size was not actual prompt_tokens
The root cause was simple but easy to miss. The benchmark parameter “prompt_size” was a synthetic knob — it controlled how many times I repeated a short text block in the prompt template. It was not the same as the actual tokenizer-counted prompt_tokens that TensorRT-LLM reported back in the usage metadata.
Because the prompt template itself had a fixed floor (system message, assistant prefix, chat formatting), all three of the tiny prompt cases — 16, 32, and 64 — tokenized to roughly the same number of input tokens: 129. They were not three distinct “tiny input” cases. They were the same input, masquerading as three different configurations.
Here’s what the actual token counts looked like across all prompt sizes (non-streaming mode, aggregated across all concurrency levels):
| prompt_size | actual prompt_tokens | completion_tokens | median latency (s) |
|---|---|---|---|
| 16 | 129 | 89 | 2.09 |
| 32 | 129 | 89 | 2.09 |
| 64 | 129 | 89 | 2.08 |
| 128 | 177 | 62 | 1.47 |
| 256 | 300 | 72 | 1.69 |
| 512 | 544 | 83 | 1.94 |
| 768 | 787 | 90 | 2.14 |
| 900 | 914 | 83 | 1.98 |
Three things jump out:
- 16, 32, and 64 are the same input. The benchmark’s “tiny prompt” settings were all tokenized to 129 tokens because the chat template had a floor.
- Completion tokens varied significantly. The tiny prompts generated ~89 completion tokens on average, while prompt_size 128 generated only ~62. That’s a 43% difference in output length.
- Total latency is not a monotonic function of prompt_size. The 128 case was faster than 16, 32, 64, and 512 — not because prefill was faster (it was, but that’s not the whole story).
This is a useful lesson for anyone doing inference benchmarking: if you control prompt size with a synthetic parameter, you need to verify what the tokenizer actually produces. The synthetic parameter and the real token count can tell completely different stories.
Total latency was decode-heavy
Total latency is the sum of queue/scheduling time, prefill time (TTFT), and decode time. When I looked at the total latency graph, the small-prompt cases looked slow. But they weren’t slow because the prefill was slow — they were slow because they generated more output tokens.
The tiny prompts (16/32/64, all 129 actual input tokens) produced about 89 completion tokens on average. The prompt_size 128 case produced only about 62. That means the decode phase alone was ~43% longer for the tiny prompts.
So the high total latency for the tiny prompts was primarily a decode effect, not a prefill effect. The prefill for 129 tokens is fast. The decode for 89 tokens is not.
This is why total latency alone can mislead. It conflates two very different phases of inference: processing the input prompt and generating the output tokens. If your benchmark doesn’t control for output length, you won’t know which phase is driving the numbers.
The cleaner graph: P95 TTFT vs. in-flight input-token pressure
Once I realized that total latency was being driven by decode length as much as by prefill, I needed a cleaner signal for input-side pressure. TTFT (time to first token) is that signal. It measures how long the server takes to start generating a response, which includes the prompt processing / prefill phase. It does not include decode.
I plotted P95 TTFT (from the streaming runs) against in-flight input-token pressure, where pressure is defined as:
in-flight input tokens = concurrency x actual tokenizer-counted prompt_tokensThe result is the main graph for this article.
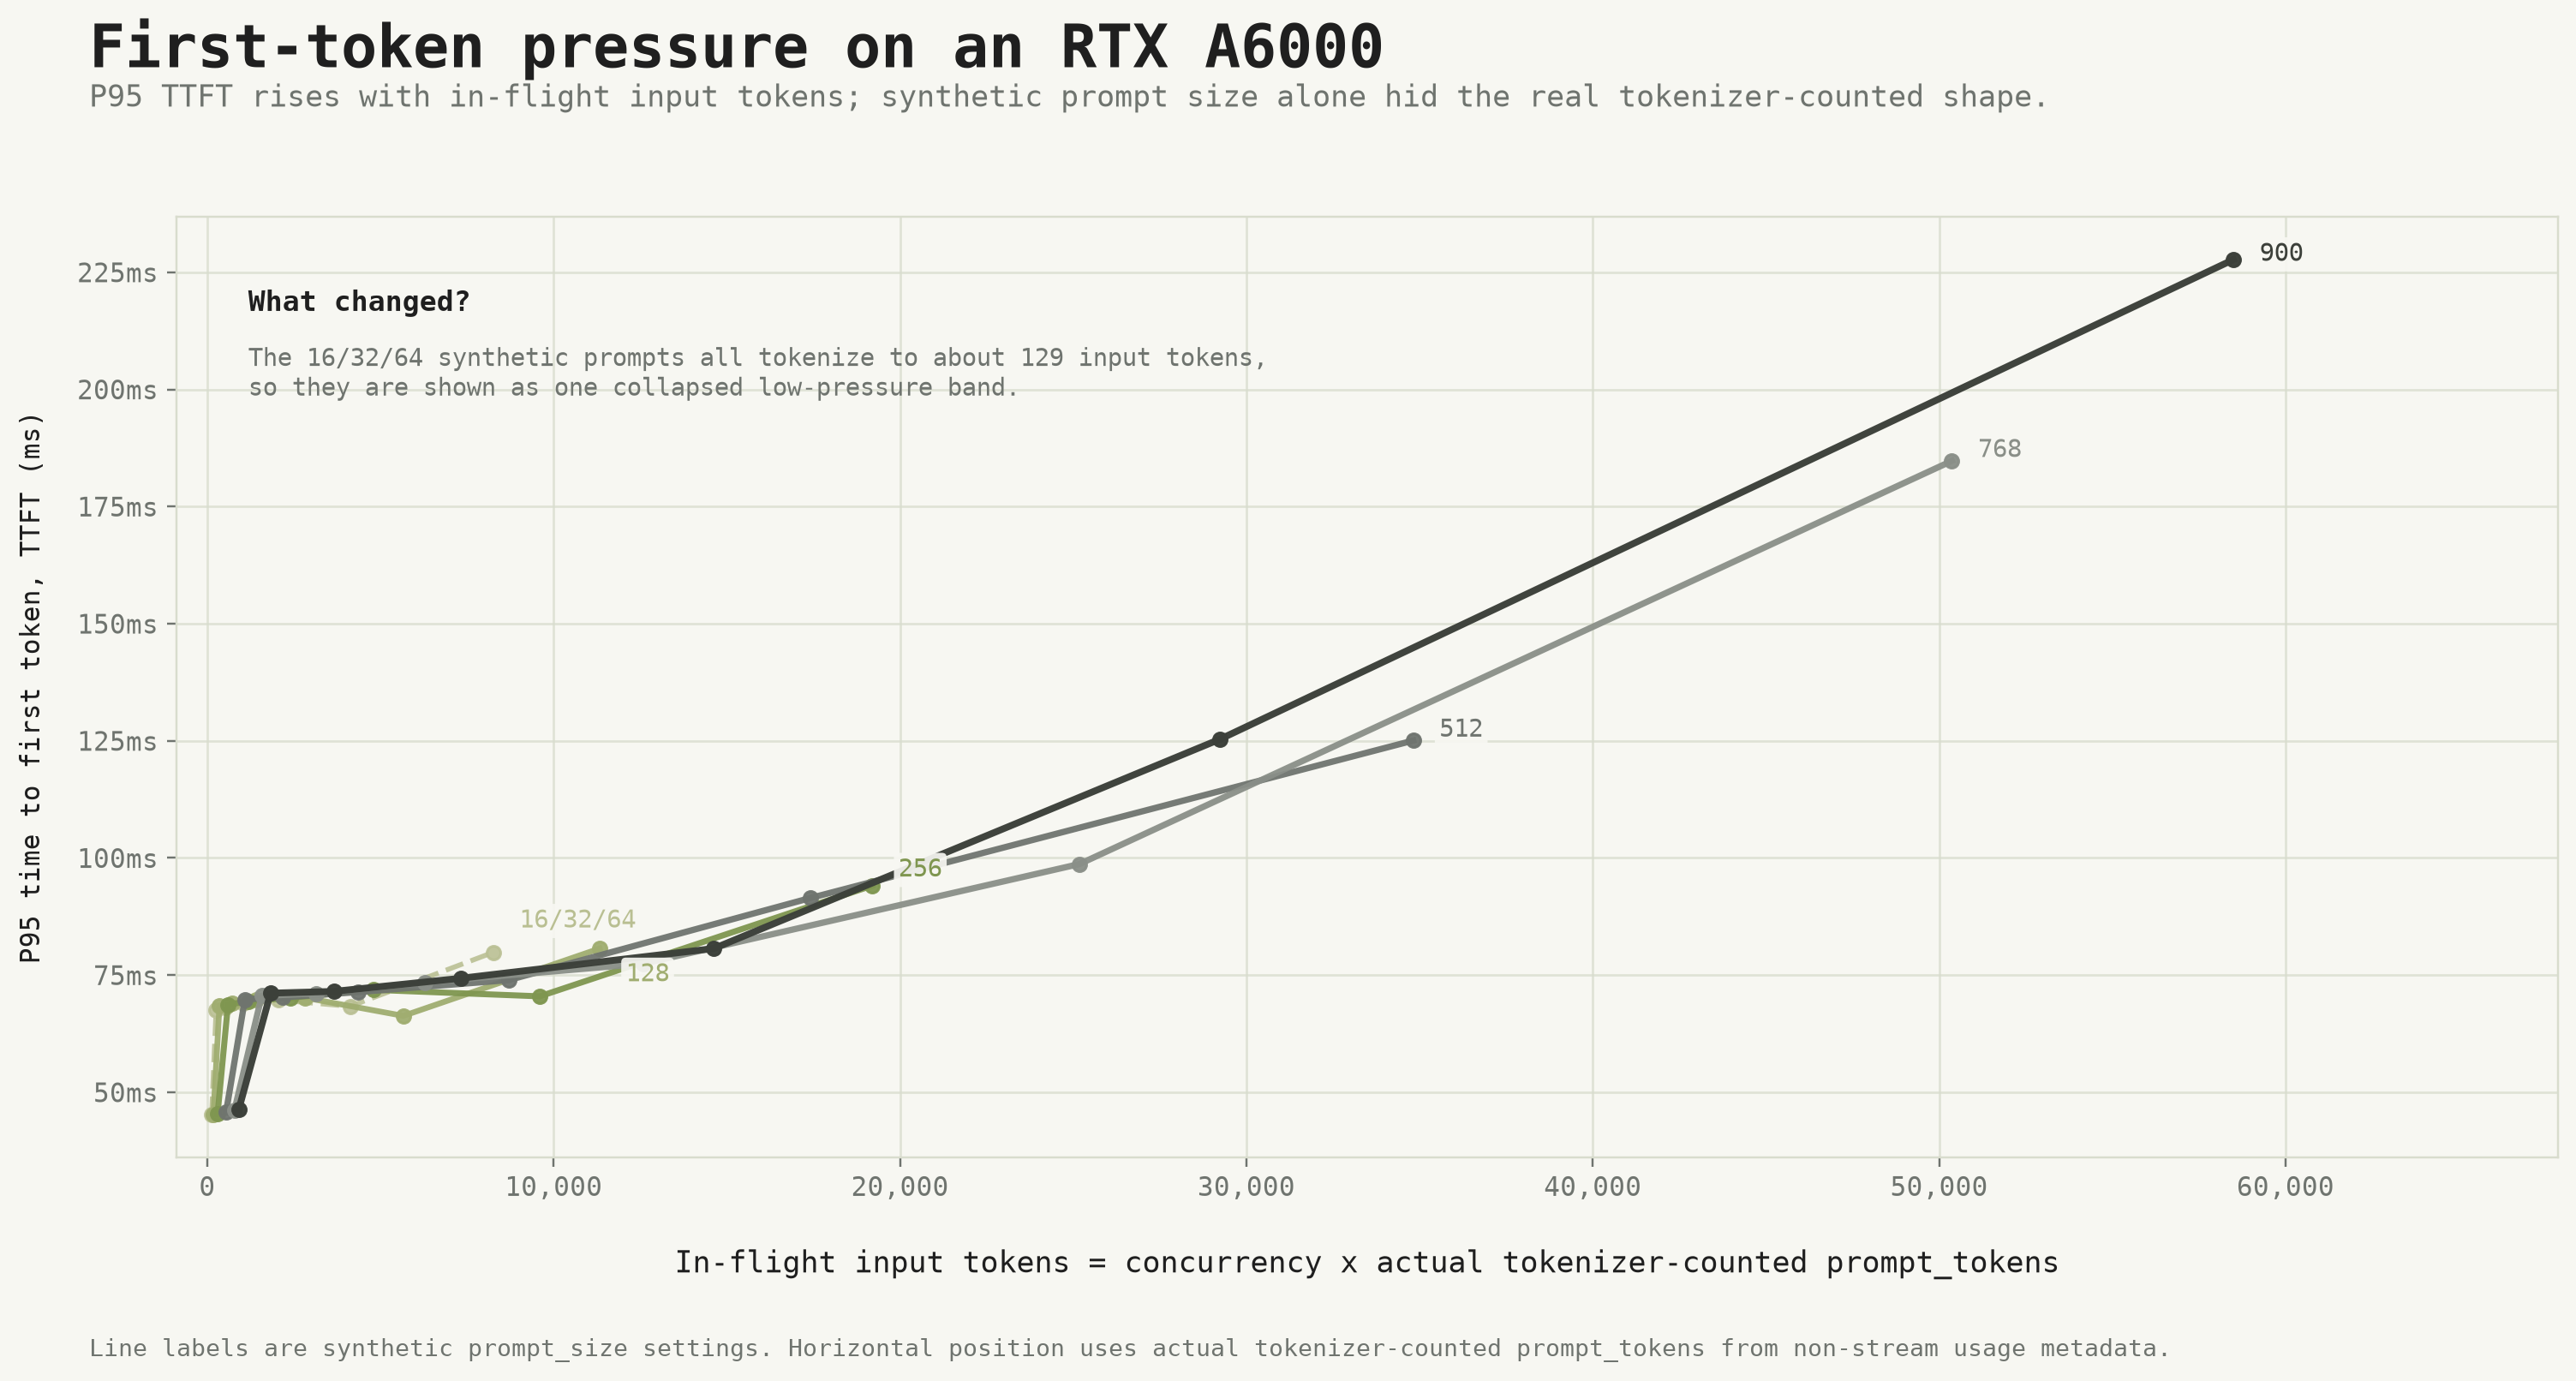
First-token pressure on an RTX A6000.
A few notes on reading this graph:
- The x-axis is in-flight input-token pressure. At concurrency 1 with prompt_size 128 (177 actual tokens), the pressure is 177. At concurrency 64 with prompt_size 900 (914 actual tokens), the pressure is 57,600.
- The 16/32/64 lines collapse into one. Because all three tokenized to the same 129 actual tokens, they produce the same data points at every concurrency level. They’re effectively one line.
- The y-axis is P95 TTFT in milliseconds. The 95th percentile across 32 requests at each configuration.
The shape of the curve tells a clear story:
- At low in-flight input-token pressure (below roughly 2,000 tokens), P95 TTFT stays relatively flat. It hovers around 45-70 ms regardless of the synthetic prompt_size. The GPU handles small inputs with minimal queuing.
- At higher pressure, the curve starts to separate by prompt_size. The larger prompts (512, 768, 900) begin to show higher TTFT than the smaller ones.
- At the highest pressure (concurrency 64), the separation is dramatic. The 900-prompt case reaches ~228 ms P95 TTFT, while the collapsed 16/32/64 line is at ~80 ms. The 768 case sits at ~188 ms.
Here’s the full P95 TTFT breakdown by concurrency and prompt_size (streaming mode):
| prompt_size | conc=1 | conc=2 | conc=4 | conc=8 | conc=16 | conc=32 | conc=64 |
|---|---|---|---|---|---|---|---|
| 16 | 45.3 | 67.9 | 68.1 | 69.1 | 70.0 | 68.5 | 80.8 |
| 32 | 45.2 | 67.5 | 68.6 | 69.4 | 70.6 | 69.7 | 78.8 |
| 64 | 45.1 | 67.6 | 68.1 | 68.8 | 69.5 | 67.9 | 80.4 |
| 128 | 45.2 | 68.5 | 69.1 | 69.8 | 70.2 | 67.0 | 80.7 |
| 256 | 45.5 | 68.7 | 69.5 | 70.3 | 72.0 | 71.1 | 95.0 |
| 512 | 45.7 | 69.8 | 70.3 | 71.4 | 74.1 | 91.6 | 125.1 |
| 768 | 46.2 | 70.6 | 71.2 | 73.6 | 77.6 | 99.9 | 187.7 |
| 900 | 46.4 | 71.2 | 71.6 | 74.4 | 81.3 | 125.7 | 227.9 |
The pattern is consistent: under low load, the server handles everything smoothly. Under heavy load, the larger prompts feel the pressure first and most severely.
What this says about prefill and decode
This benchmark makes the prefill/decode distinction concrete.
TTFT is an outside measurement that captures the impact of prompt processing. It includes the time to tokenize the input, run the prefill pass through the model, and generate the first token. On a single GPU, this is dominated by the prefill computation, which scales with the number of input tokens.
Decode determines how long the response takes to finish. Once the first token is out, the model generates tokens one at a time, each requiring a full forward pass through the model. This is where output length matters most.
In this test, TTFT showed input-side pressure more cleanly than total latency. Total latency mixed prefill and decode, making it hard to tell which phase was driving the numbers. TTFT isolated the prefill signal.
The KV cache plays a role here too. As TensorRT-LLM processes larger prompts, it allocates more KV cache entries. Under concurrency, these allocations compound. When the GPU runs low on KV cache headroom, the scheduler has to make tradeoffs — which is why the larger prompts separate more clearly at high concurrency. The first article introduced KV cache conceptually; this benchmark shows it in action.
What this does NOT prove
It’s important to be honest about the limitations of this benchmark:
- This is not a production benchmark. The RTX A6000 is a single GPU. Production serving involves multiple GPUs, multiple workers, networking, and a request router.
- This is not a long-context benchmark. The largest prompt was 914 tokens. Modern models support 32K, 128K, or more. The KV cache behavior at those scales is different.
- Synthetic prompts are not real user traffic. Repeating a text block is not the same as varied natural language. The tokenizer behavior, attention patterns, and KV cache allocation will differ with real prompts.
- The server’s batching and scheduling behavior matters. TensorRT-LLM’s dynamic batching will behave differently under real traffic patterns than under a controlled benchmark sweep.
- Streaming usage metadata can be incomplete. For the token diagnostic table, I used non-streaming usage metadata because streaming
prompt_tokensin the usage object can be unreliable. The raw CSV captured both modes. - Results should be interpreted as a local serving experiment. They give a sense of how TensorRT-LLM behaves on this hardware with this model under these conditions. They are not universal claims about TensorRT-LLM.
Why this still points toward Dynamo
The first article ended by noting that single-GPU serving is just the starting point. This benchmark makes that more concrete.
Once you introduce concurrency, input-token pressure, TTFT variance, decode length, and KV cache management, the limitations of a single-server setup become apparent:
- Prefill and decode compete for GPU compute. Large prompts slow down the first token for everyone else.
- KV cache is finite. Under concurrency with varied prompt sizes, the GPU runs out of space for cached key-value pairs.
- Latency is non-deterministic. The P95 TTFT at high concurrency was 2.8x the P95 TTFT at low concurrency for the largest prompts. That’s not a small difference.
- Output length is unpredictable. The same input can produce very different output lengths, making total latency hard to bound.
These are exactly the problems that disaggregated serving frameworks like Dynamo are designed to address. By separating prefill and decode onto different GPUs, you prevent large prompts from starving the decode phase. By introducing a request router, you can balance load across workers. By managing KV cache across the cluster, you avoid the per-GPU headroom problem.
This local benchmark doesn’t deploy Dynamo. It doesn’t need to. It shows, with real numbers, why the single-server model hits a wall when concurrency and prompt variation enter the picture.
Interview takeaway
If someone asked me what I learned from this benchmark, I’d say it like this:
I extended my single-GPU TensorRT-LLM benchmark by adding concurrency and prompt-pressure testing. The interesting lesson was that synthetic prompt size wasn’t enough — I had to inspect actual tokenizer-counted prompt_tokens and completion_tokens. Total latency was affected heavily by decode length, while P95 TTFT was a cleaner signal for input-side pressure. That gave me a more practical understanding of prefill, decode, and why production systems care about batching, KV cache management, and frameworks like Dynamo.
What I would improve next
If I ran this again, I’d make several changes:
- Use real prompts instead of synthetic repeated text. A dataset of actual user queries would give more realistic token distributions and attention patterns.
- Separate fixed-output tests from open-ended generation. If I want to isolate prefill behavior, I should control output length — either with a fixed
max_tokensthat the model actually hits, or with a separate benchmark that only measures TTFT without decode. - Compare TensorRT-LLM with vLLM or llama.cpp. A side-by-side benchmark on the same hardware would show how different serving engines handle the same workload.
- Add longer context tests. Pushing prompts into the 4K-32K token range would reveal KV cache pressure that doesn’t show up at 900 tokens.
- Explore Dynamo / disaggregated serving more directly. The next logical step after this benchmark is to set up a two-GPU test: one for prefill, one for decode, and measure the difference.
That’s the next article.